


Maricopa County buyers had more homes to choose from in September 2026 as active inventory climbed, even as pending contracts declined. Sale prices edged higher, illustrating why inventory, demand, and pricing need to be considered together.
Maricopa County Housing Market: September 2026
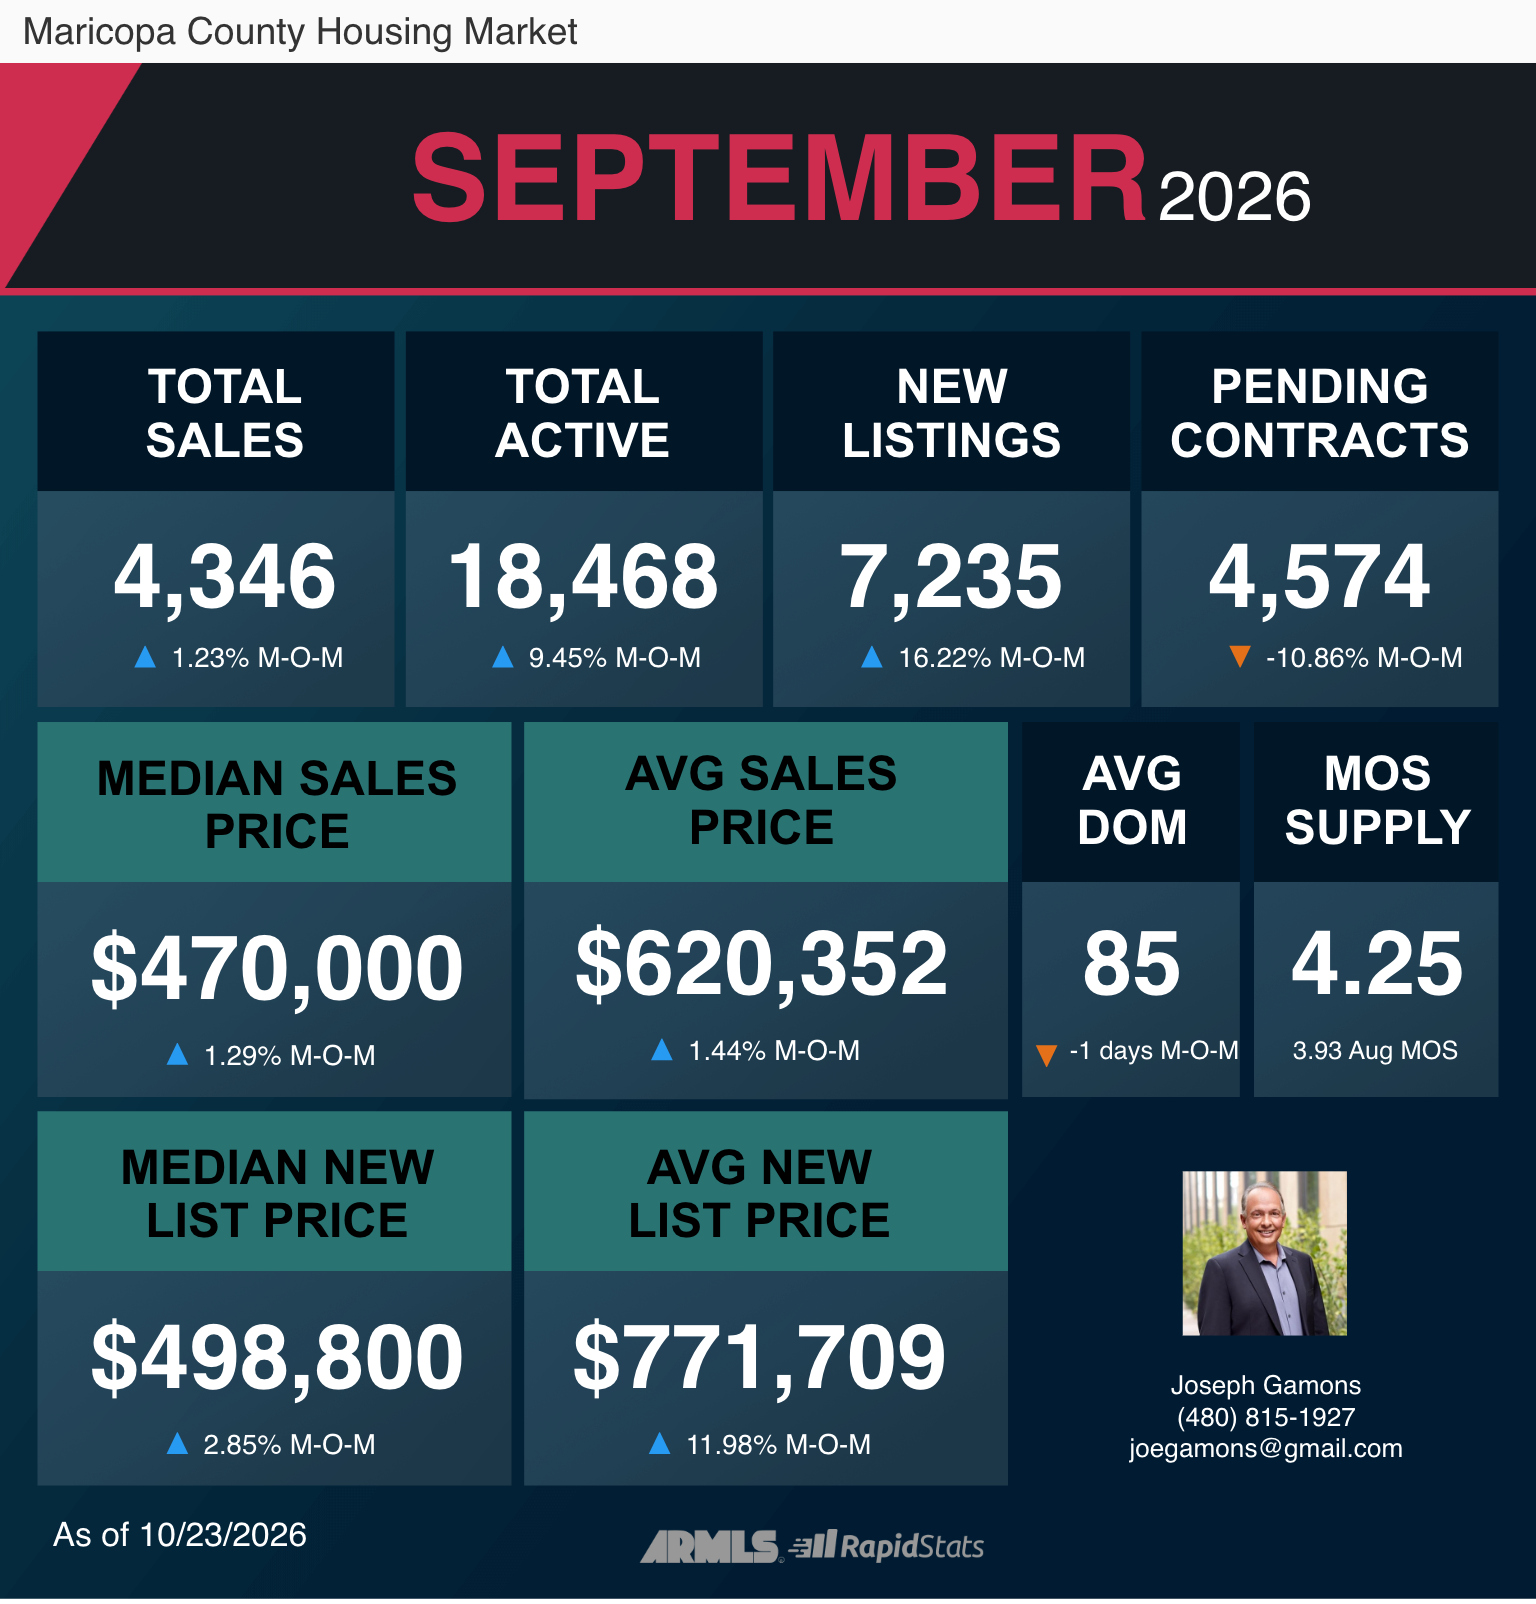
ARMLS/RapidStats residential report for Maricopa County, September 2026; generated October 23, 2026. Month-over-month changes compare September with August 2026.
September by the Numbers
- Total sales: 4,346, up 1.23% from August.
- Active listings: 18,468, up 9.45%.
- New listings: 7,235, up 16.22%.
- Pending contracts: 4,574, down 10.86%.
- Median sales price: $470,000, up 1.29%.
- Average sales price: $620,352, up 1.44%.
- Median new list price: $498,800, up 2.85%.
- Average new list price: $771,709, up 11.98%.
- Average days on market: 85 days, one day fewer than August.
- Months of supply: 4.25, compared with 3.93 in August.
What This Means for Buyers
The number of active homes for sale increased 9.45%, giving buyers more options across Maricopa County. With 4.25 months of inventory and an average of 85 days on market, some buyers may have room to negotiate, especially on homes that have been listed longer or compete with similar properties.
More choices do not guarantee a discount on every home. The right offer still depends on condition, location, asking price, and comparable sales.
What This Means for Sellers
New listings climbed 16.22% while pending contracts fell 10.86%. That means fresh competition increased even as the number of properties going under contract declined during September. Sellers should pay close attention to pricing and presentation.
The median new list price reached $498,800, while the median sales price was $470,000. These measure different groups of homes and should not be interpreted as a typical negotiating gap. Likewise, a rising countywide median sales price does not mean every home's value increased by 1.29%.
Joe's Take
September's numbers point to a market with more inventory and greater competition among sellers, even though closed sales and median prices rose slightly. For buyers, that creates more opportunities to compare homes without rushing. For sellers, the best strategy is to price realistically from the start and present the property well.
Countywide trends are only a starting point. Conditions can vary significantly by neighborhood and price range. If you are considering buying or selling, I can help you review the local competition and recent sales that matter to your decision.
Browse Phoenix Homes for Sale | Contact Joe Gamons
Joe Gamons | Cerreta Realty Group
(480) 815-1927
Source: ARMLS/RapidStats residential market infographic for September 2026, Maricopa County filter, generated October 23, 2026. Figures reflect selected report filters and may be revised.